Enterprise-Grade Monitoring.
Accessible Pricing.
Combine our plug-and-play hardware appliance with powerful cross-platform agents for total real-time visibility into your network, servers, and infrastructure.
One Solution for all your needs!
PingyThingy started as a personal project to solve a simple problem: "How can I proactively monitor my network and reduce callouts?" Wanting to reduce time spent and incoming calls or tickets raised, I decided to do some research and find a tool that would really help. Unfortunately, I didn't find one that worked for me. They were too bulky, costly or just didn't give me what I needed.
So, I decided to build the exact tool I wanted. One that's fast, looks good, and does the job without unnecessary complexity. This product is the result of that effort, built with practicality in mind and focusing on the features that actually matter for day-to-day monitoring. I hope it helps you tame your network chaos as much as it has helped me.
Infrastructure Visibility
PingyThingy tracks what matters, from the cable to the container.
Hardware Appliance
The brain of your operation. It handles pings, port checks, DHCP uploads, and network scans locally—no data ever leaves your building.
Deep System Agents
Install lightweight agents on Win/Mac/Linux to track SMART health, GPU thermals, ZFS pools, and RAID status in real-time.
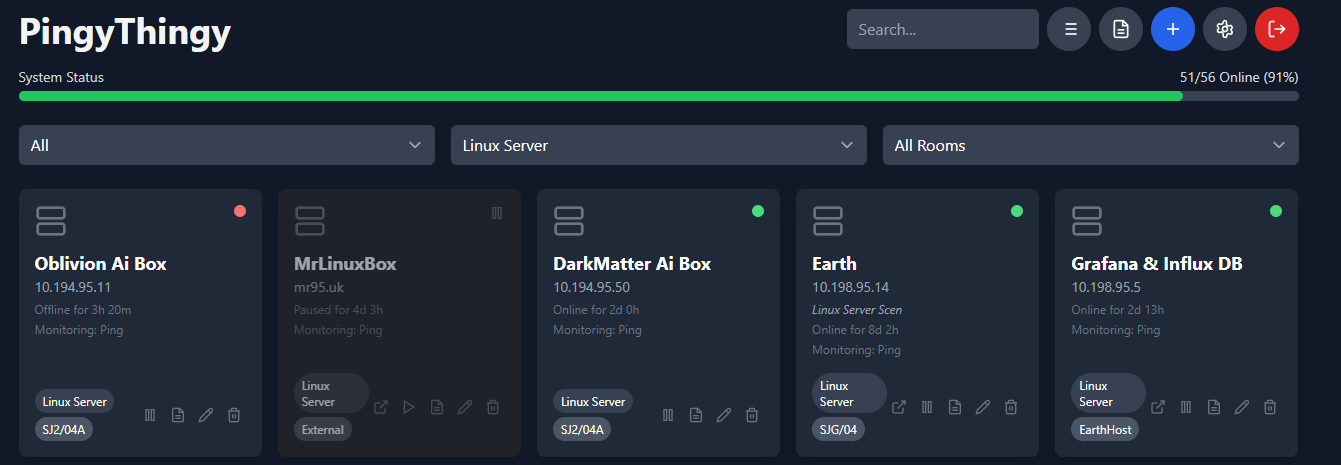
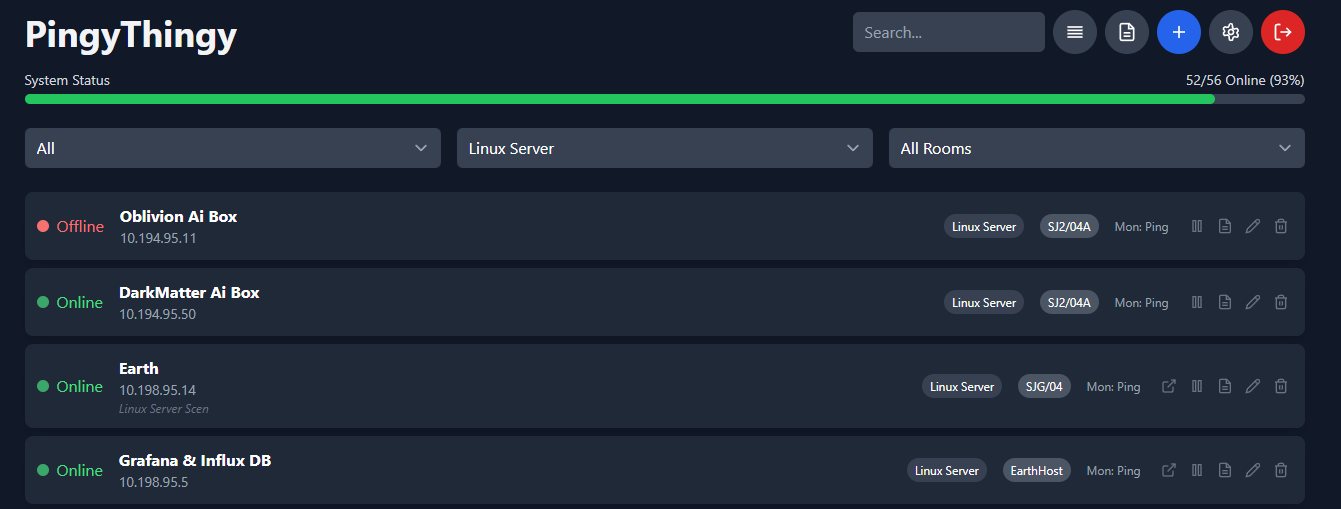
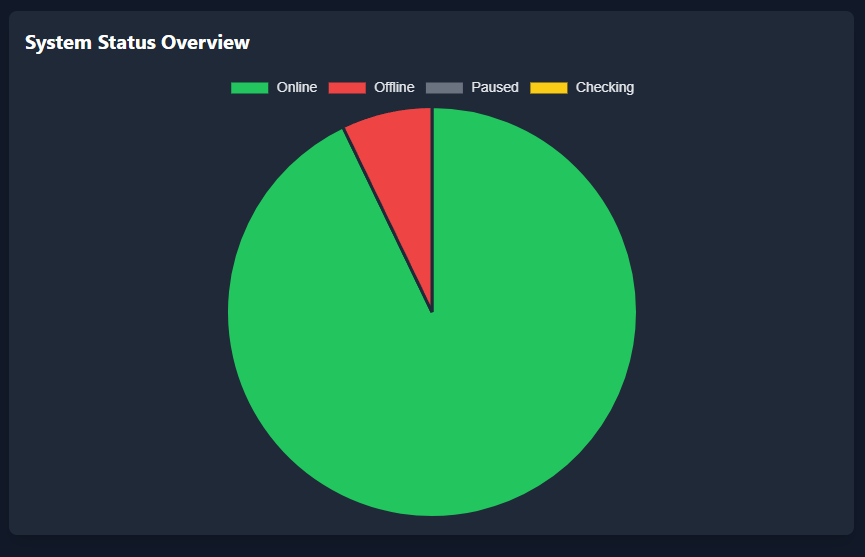
Hosted Global UI
Access your dedicated dashboard from anywhere. Switch between 5 premium layouts including Pie Charts, Real-time Graphs, and Room Views.
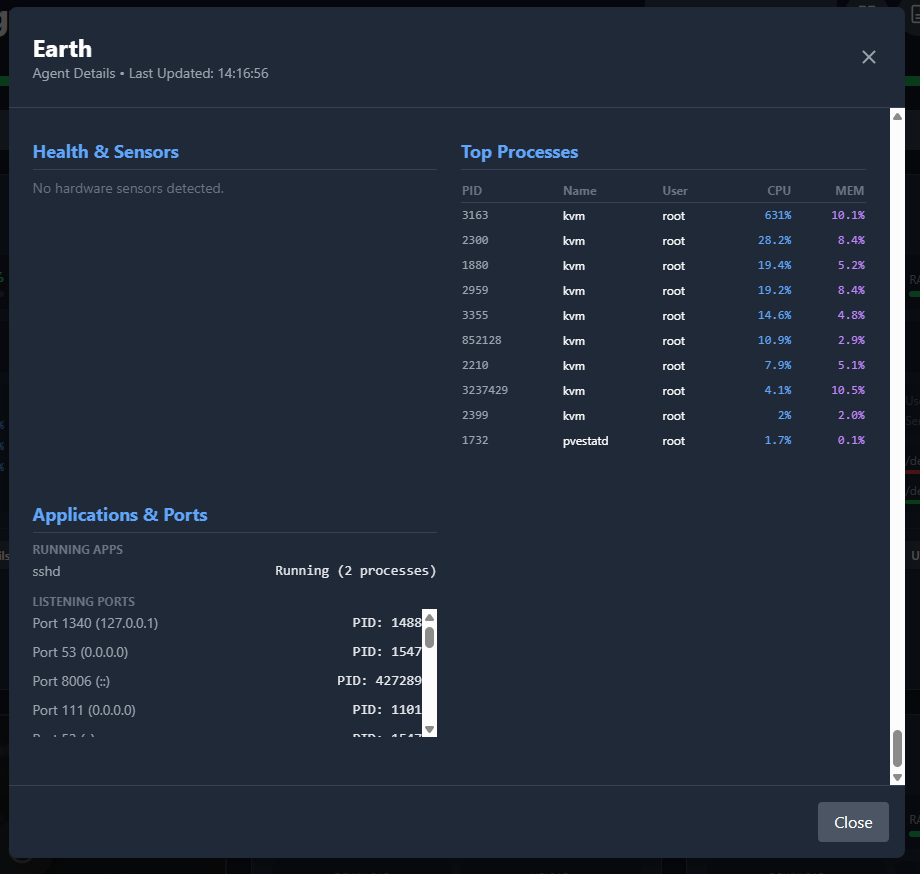
Beyond the Ping
Our lightweight agents stream rich telemetry directly to your dashboard — no complex configuration required.
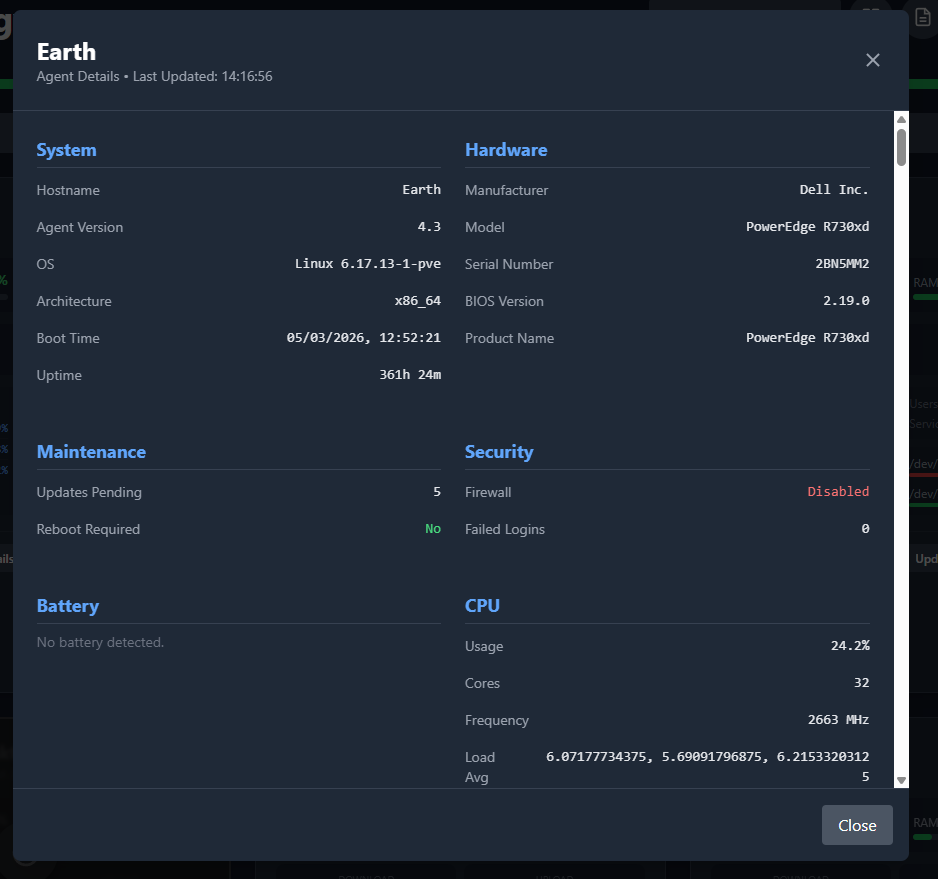
System
- Hostname & OS Version / Kernel
- Uptime & Boot Time
- CPU Architecture
Hardware
- Manufacturer & Model
- Serial Number
- BIOS Version
CPU
- Usage — Total & Per Core
- Frequency (Current / Min / Max)
- Load Average
RAM
- Total, Used & Available
- Swap Usage
Storage
- Partition Usage & IO Speeds
- ZFS Pools & RAID Arrays
- SMART Drive Health
Network & Connectivity
- Upload / Download Speeds
- Public & Local IP, Packet Loss
- WiFi SSID & Signal Strength
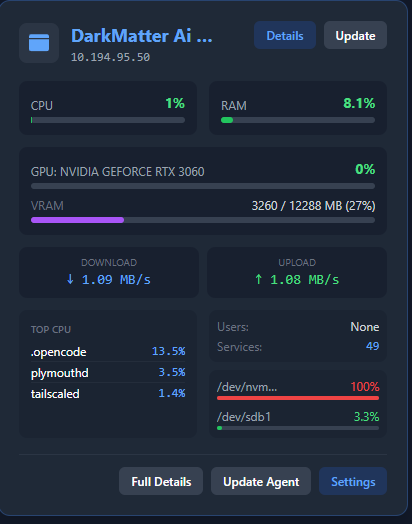
GPU (NVIDIA)
- Usage & VRAM
- Temperature & Power Draw
- Active Process List
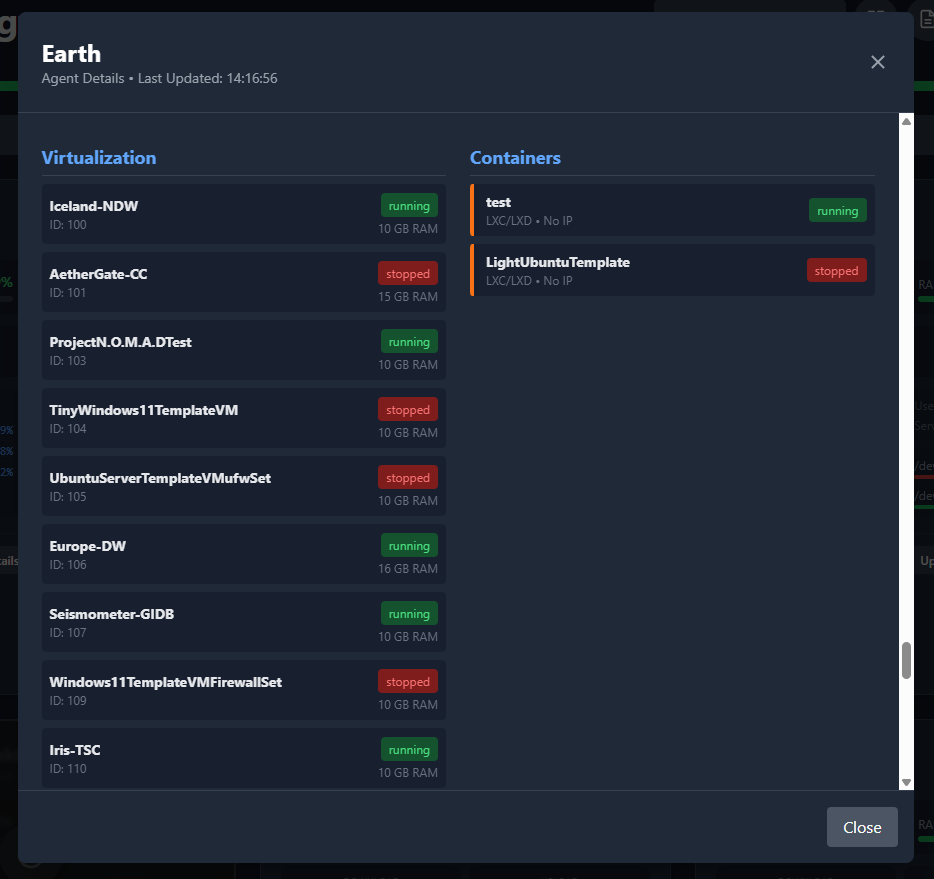
Apps & Services
- Systemd Services & Top Processes
- Docker & LXD Containers
- KVM / Libvirt & Proxmox VMs
Security
- Firewall Status
- Failed SSH Login Attempts
- Listening Ports
Maintenance
- Pending System Updates
- Reboot Required Status
Sensors
- Fan Speeds & Temperatures
- Battery Levels
More coming soon
Additional metrics are actively being developed.
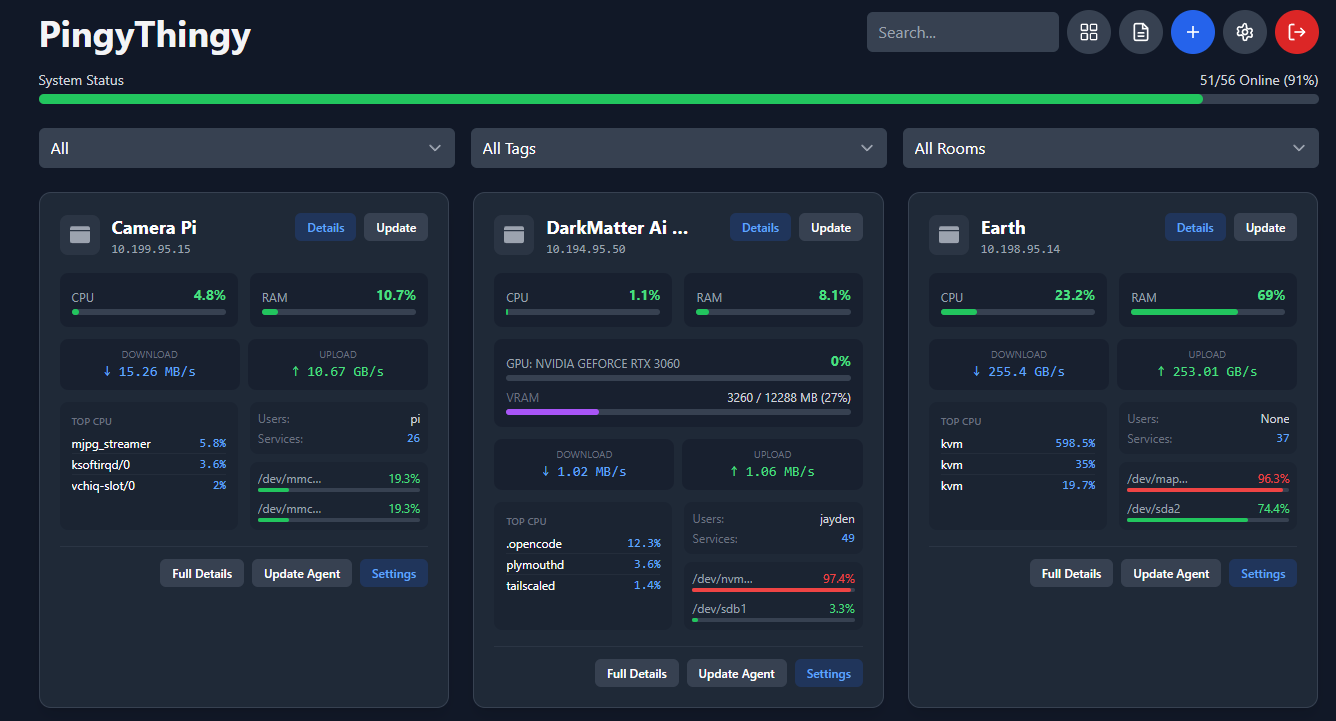
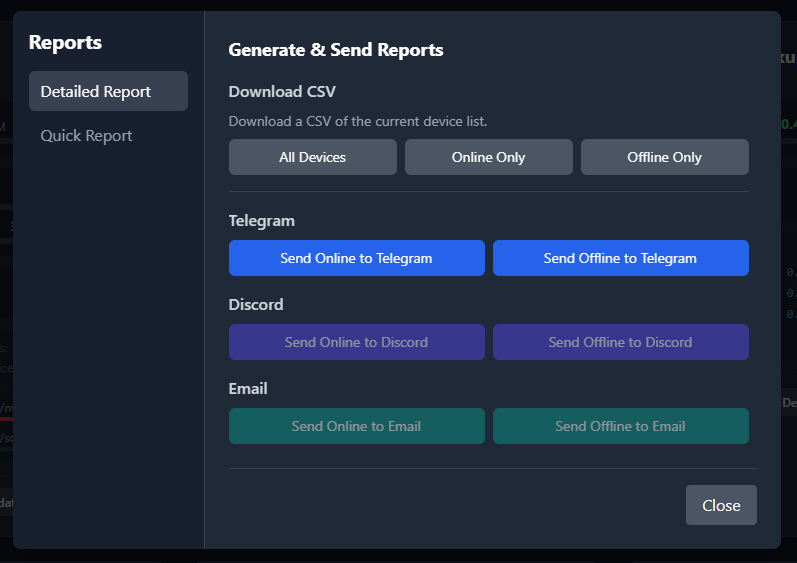
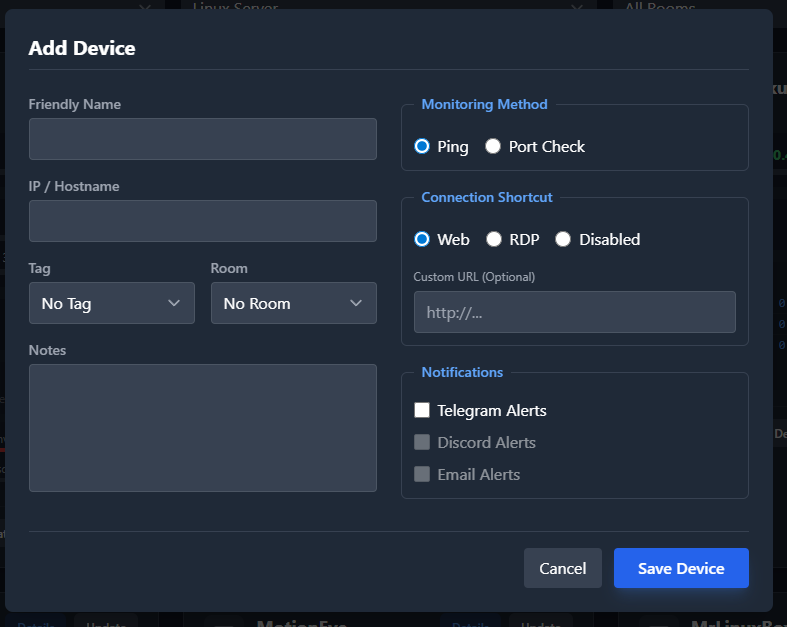
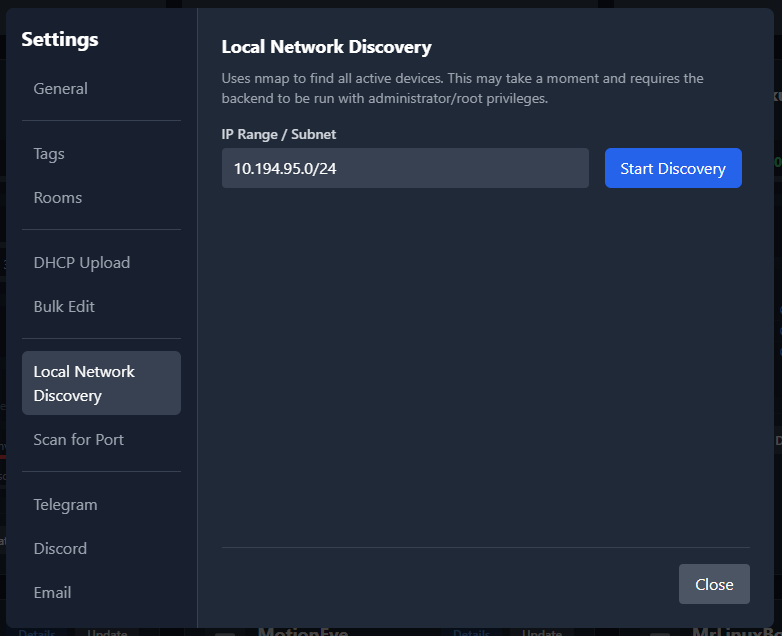
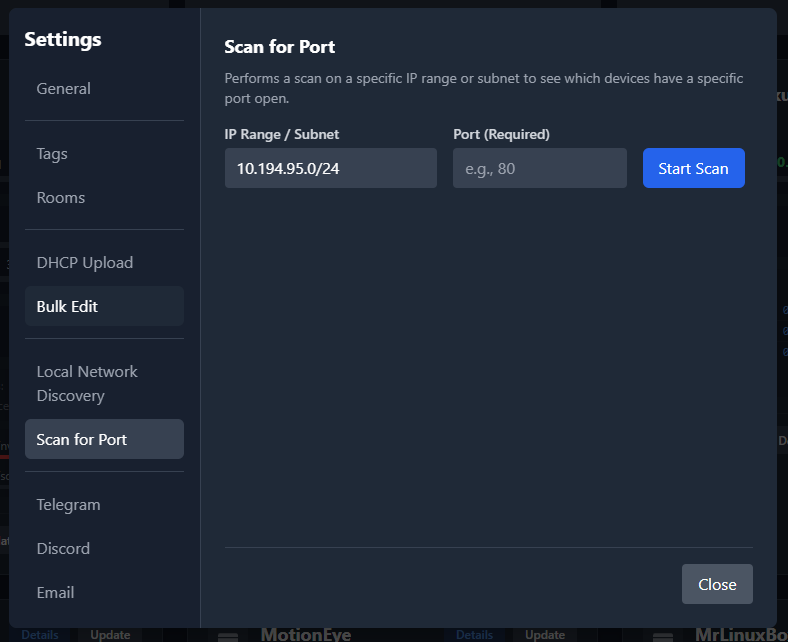
System Preview
Take a look inside the PingyThingy interface and agent telemetry.
One-Time Pricing
Own your monitoring stack forever. No recurring "per-node" taxes.
Basic Package
Perfect for getting started with network visibility.
- 📡 Unlimited Device Pings
- 🔌 Port Checks & Scans
- 📊 1 Visual Layout
- 🚫 Agent Telemetry Disabled
- 🌐 Hosted Global UI
Advance Package
Deep telemetry for critical servers and endpoints.
- ✅ Everything in Basic
- 💻 Up to 25 Agents Activated
- 📈 3 Visual Layouts
- 📱 2 Notification Channels
- 🛠️ Includes Remote Setup
Power Advance
Designed for complex virtualization and GPU clusters.
- ✅ Everything in Advance
- 💻 Up to 100 Agents Activated
- 📊 All Visual Layouts
- 🔔 Unlimited Notifications
- 🚀 Advanced Data Retention
Enterprise Tier
Tailored for large-scale infrastructure deployments.
- Full API Access
- Unlimited Agents
- Priority Support
Maintenance Plans & Addons
Protect your investment with our optional services.
On-Site Setup
(Optional)
Maintenance Plan
(Optional)
- • Daily Config Backups
- • Priority Security Patches
- • Feature Update Access
Agent Expansion
Incremental activation
- • Expand Agent Capacity
- • Add to Any Package
Ready to Tame the Chaos?
Get in touch for a custom quote for your network today.